Online database
compilation of EM geophysical and auxiliary in-situ data
Overview
In order to serve the purpose of our fastpath app creating recharge metrics using geophysical data and in-situ sediment type data, we developed an online database. In this section, we present crucial information about the compiled online database, which can be accessed through the REDIVIS platform at https://redivis.com/KnightAccelerator/datasets. We have curated the database, and it includes various types of data from different sources, all relevant to our research objectives. Types and sources of the complied database are summarized in Table 1.
To provide a comprehensive overview of the compiled database, we will summarize the types of data and their respective sources in the upcoming sections. Each of these data types is discussed in detail in our online course.
Table 1:Types and sources of the geophysical and in-situ data used to compile the online database. Sources of the data were Stanford Environmental Geophysics Research Group (ENVGP), California Department of Water Resources (CDWR), and United States Geological Survey (USGS).
Type | Data | Measured property | Source | Link |
|---|---|---|---|---|
Geophysics | Airborne EM | Electrical resistivity | Stanford ENVGP CDWR | |
Geophysics | Towed EM | Electrical resistivity | Stanford ENVGP | N/A |
In-situ | Driller’s logs | Sediment / rock type | Stanford ENVGP CDWR | |
In-situ | Cone Penetration Test | Sediment type | Stanford ENVGP | N/A |
In-situ | Water level | Hydraulic head | CDWR | |
In-situ | Water quality | Salinity | USGS |
Geophysical data
Electromagnetic (EM) imaging proves to be a highly efficient technique for mapping the subsurface hydrogeology over vast areas. To achieve this, raw EM data is processed and inverted, resulting 1D vertical profiles of resistivity that accurately fits the EM data. These resistivity profiles, which we refer to as "resistivity data," provides invaluable insights into the subsurface geology. These “resistivity data” are the starting point of our application, we do not ingest the raw EM data.
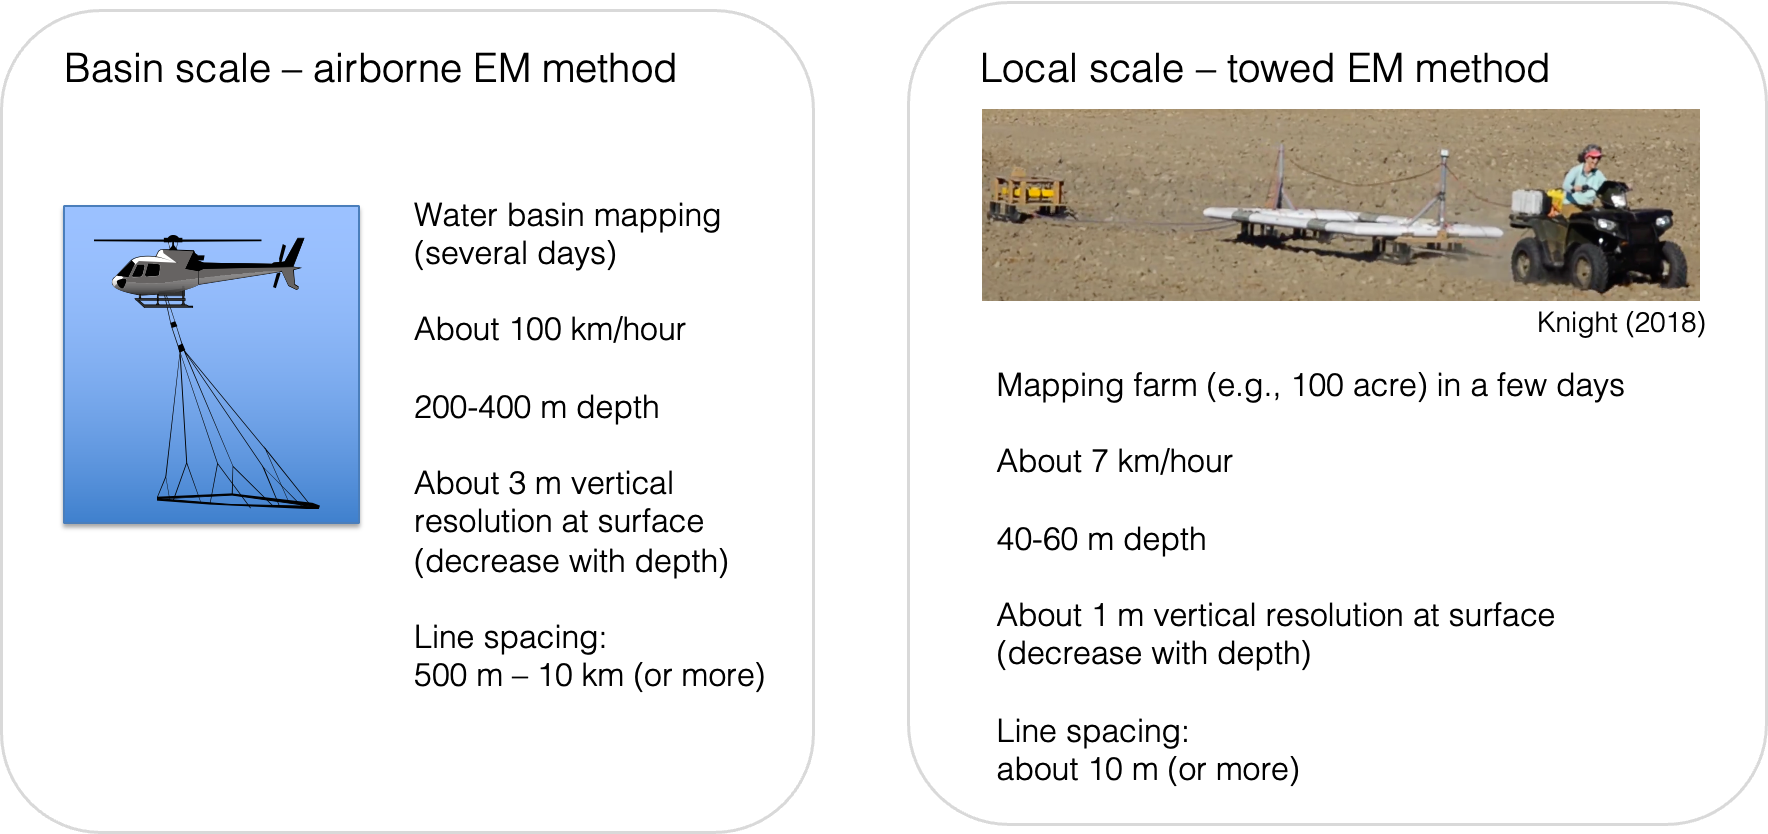
In our study, we employed two distinct EM imaging methods: airborne EM and towed EM. The airborne EM method is particularly suitable for basin-scale mapping, allowing us to cover extensive areas efficiently. On the other hand, the towed EM method is more appropriate for local-scale mapping, enabling us to obtain detailed information in specific targeted regions (Figure 1).
For a high-level comparison between these two EM imaging methods, refer to the illustration presented in Figure 1. It highlights their respective strengths and limitations, aiding in the selection of the most appropriate method based on the scale and scope of the hydrogeological investigation.

Figure 1:Comparison of the airborne EM method and the towed EM method.
The resistivity data are defined at numerous locations as an aircraft or vehicle moves over the area of interest. At each location, a vertical resistivity profile is generated, usually comprising 20-40 vertical intervals. By stitching together these resistivity profiles along a flight line (or drive line), we can generate a vertical section of the resistivity, as depicted in the illustration provided in Figure 2. This vertical section offers a valuable visualization of the subsurface resistivity variations, enabling us to gain crucial insights into the hydrogeological features and formations beneath the surveyed area.

Figure 2:An example resistivity section obtained from the fastpath app; within in the Kaweah Subbasin, CA, USA.
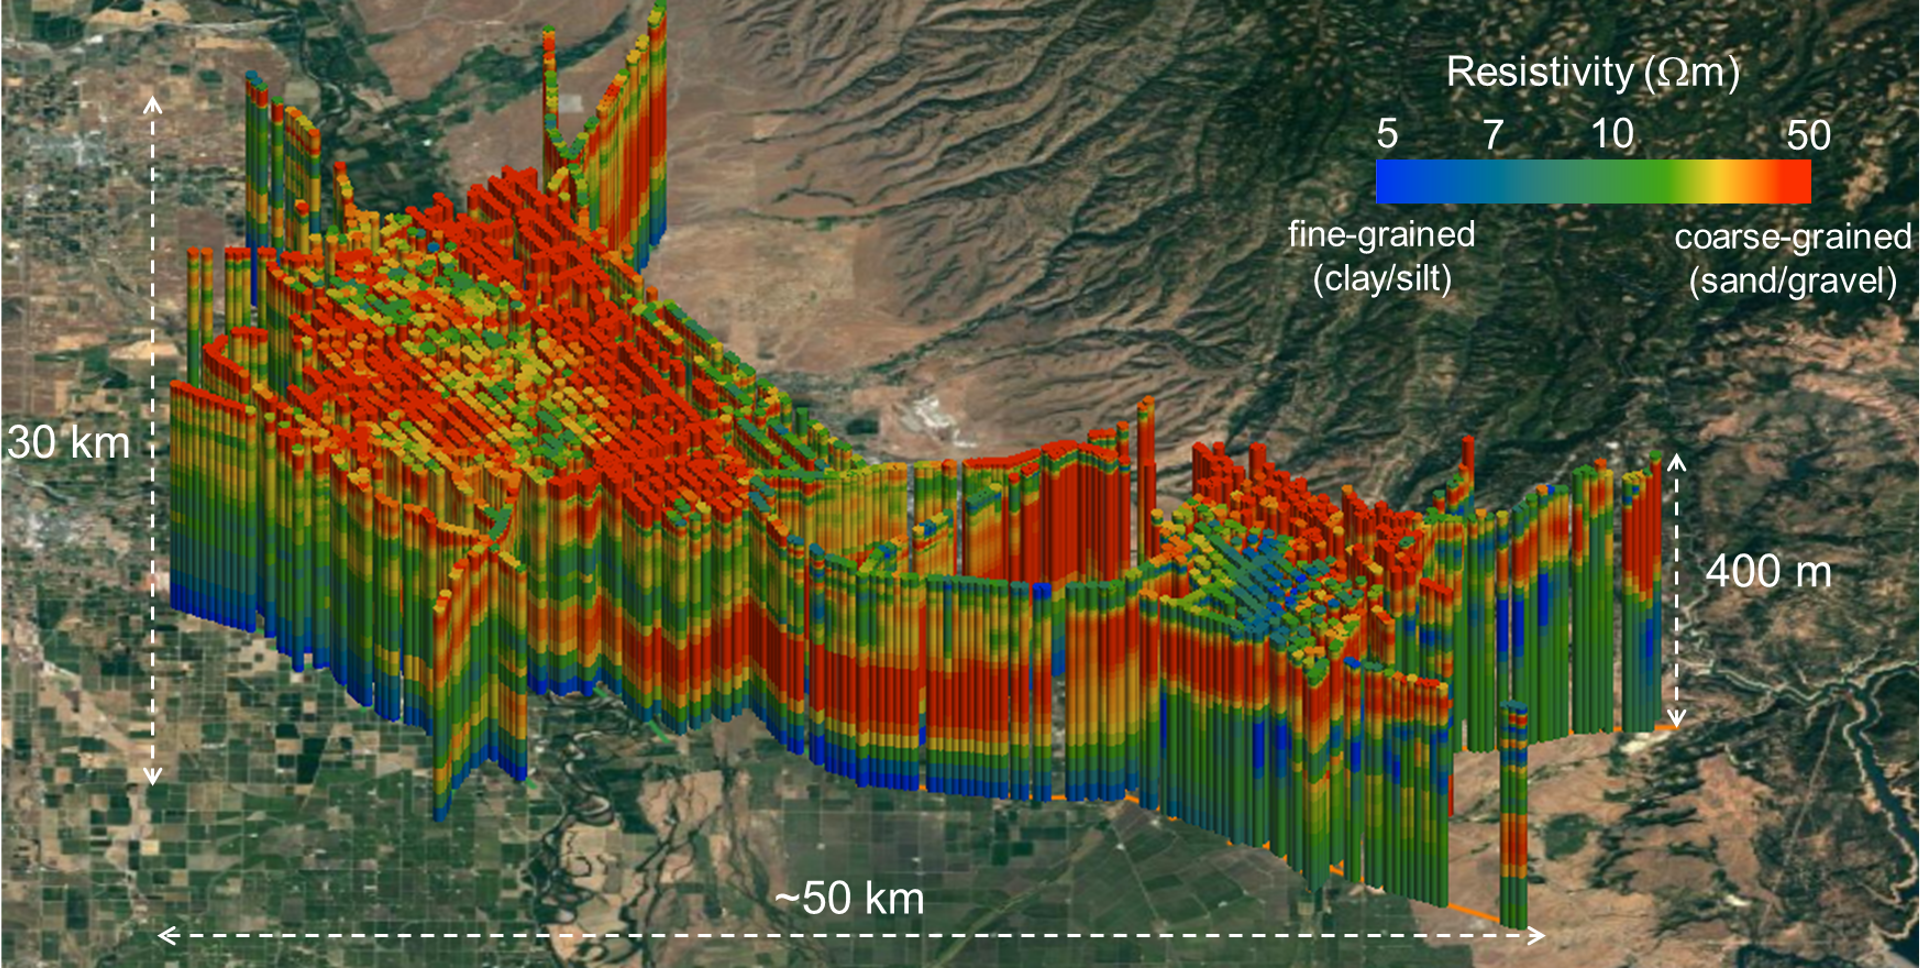
The resistivity data are can also be visualized in a three-dimensional space as shown in Figure 3.

Figure 3:An example resistivity data in a three-dimensional space Kang et al., 2021.
In addition to the resistivity data, there are other essential metadata linked to each location, including transmitter height and elevation. As of our database consists of a substantial collection of 497,041 resistivity profiles, sourced from either CDWR or Stanford ENVGP. These compiled EM data are stored in our database, accessible at the following link: https://doi.org/10.57761/d1tw-he08.
Sediment / rock type data
While the resistivity data from EM imaging is useful for imaging the subsurface hydrogeology (e.g., sediment / rock type), resistivity does not provide direct information about the hydrogeology. This can result in a large uncertainty when inferring hydrogeology from the resistivity data. Therefore, there is a critical need to build a relationship between resistivity (from geophysics) and hydrogeology (from in-situ drilling).
The three major approaches for directly measuring sediment / rock type for hydrogeologic applications are:
- Driller’s logs
- Cone Penetration Testing (CPT)
- Cores
From these approaches, a vertical profile of sediment / rock type is obtained. For instance, each vertical interval of driller’s log contains written descriptions about sediment / rock type. For the specific purpose of our web-application, we classified these descriptions into four simple categories:
- fine (fine-grained materials such as clay and silt)
- coarse (coarse-grained materials such as sand and gravel)
- rock (consolidated rocks)
- unknown (no data)
Similar classification was applied to the CPT data; for further details see Goebel & Knight (2021). A total of 43,425 vertical profiles of the sediment / rock type data were compiled to our database; these data were from either CDWR or Stanford ENVGP. The compiled EM data are accessible through our database: https://doi.org/10.57761/gcny-mc19.
Water level data
Our application focus on the vadose zone, which spans from the surface to the water table. To assess the extent of this zone accurately, we rely on groundwater level data. This data was obtained from the SGMA Data Viewer, curated by Bill Brewster. The timeframe for our groundwater level data spans from 2018 to 2022, corresponding to the period of EM data acquisition in our database.
However, it's important to note that the temporal sampling rate of this groundwater level data was limited, with only two measurements per year—during spring and fall. This limitation prompted us to align the EM survey seasons with the appropriate corresponding groundwater data. Based on the seasonal variation of groundwater levels, where peaks are typically observed near the end of winter and troughs around the end of summer, we categorized EM surveys conducted between June and December as "Fall," while those conducted during other periods were labeled as "Spring." The water level data were from a total of 23,172 water wells. The compiled water level data are accessible through our database: https://doi.org/10.57761/ga6s-zd63.
Water quality data
An important foundational assumption of our web application is that groundwater salinity levels are not excessively high (e.g., TDS > 1000 mg/L) and exhibit relatively minor variation across regions. This assumption is critical because the resistivity data obtained through EM imaging is particularly sensitive to changes in salinity. Therefore, in regions where salinity significantly impacts the data, we advise against using our approach. To address this concern and delineate areas with potentially high salinity, we compiled water quality data from the GAMMA database provided by USGS, focusing on the time span between 2010 and 2022. Each well in this dataset contains one or more measurements taken over time. For each well, we calculated the maximum salinity value across the entire time span. If this maximum value exceeded 1000 mg/L, we categorized the corresponding well as "Brackish"; otherwise, it was labeled as "Fresh." The classification of "Brackish" and "Fresh" wells was derived from information available on a USGS webpage. The water quality data were from a total of 3,631 water wells. The compiled water level data are accessible through our database: https://doi.org/10.57761/48pc-8s28.
Other data sets
Bedrock surface
In certain areas of California, such as the eastern edge of the San Joaquin Valley, the elevation of the bedrock surface is relatively shallow, making it possible for the EM imaging to capture its image. However, for our specific focus on the sedimentary aquifer system, it becomes necessary to distinguish the bedrock surface and disregard the resistivity data below it. To accomplish this, we visually inspected the resistivity data and interpreted the location of the bedrock surface at each point. The process involved identifying the presence of the resistive bedrock initially in the Sierra Nevada region and then outlining the continuous bedrock surface as it extended towards the valley.
For easy access to the compiled bedrock surface data, it is available in our database at the following link: https://doi.org/10.57761/d1tw-he08.
Resistivity contours
While we have compiled in-situ water quality data, the spatial density of the data is insufficient to fully capture the extent of brackish regions accurately. To overcome this limitation, we devised a solution by calculating resistivity contours using the resistivity data available in our database.
Firstly, we computed the vertical average of the resistivity values from the surface to the water table (or the bedrock surface if the water table lies below it). We employed harmonic averaging to incorporate the physics of the EM experiments, resulting in averaged resistivity values at each location of the resistivity data.
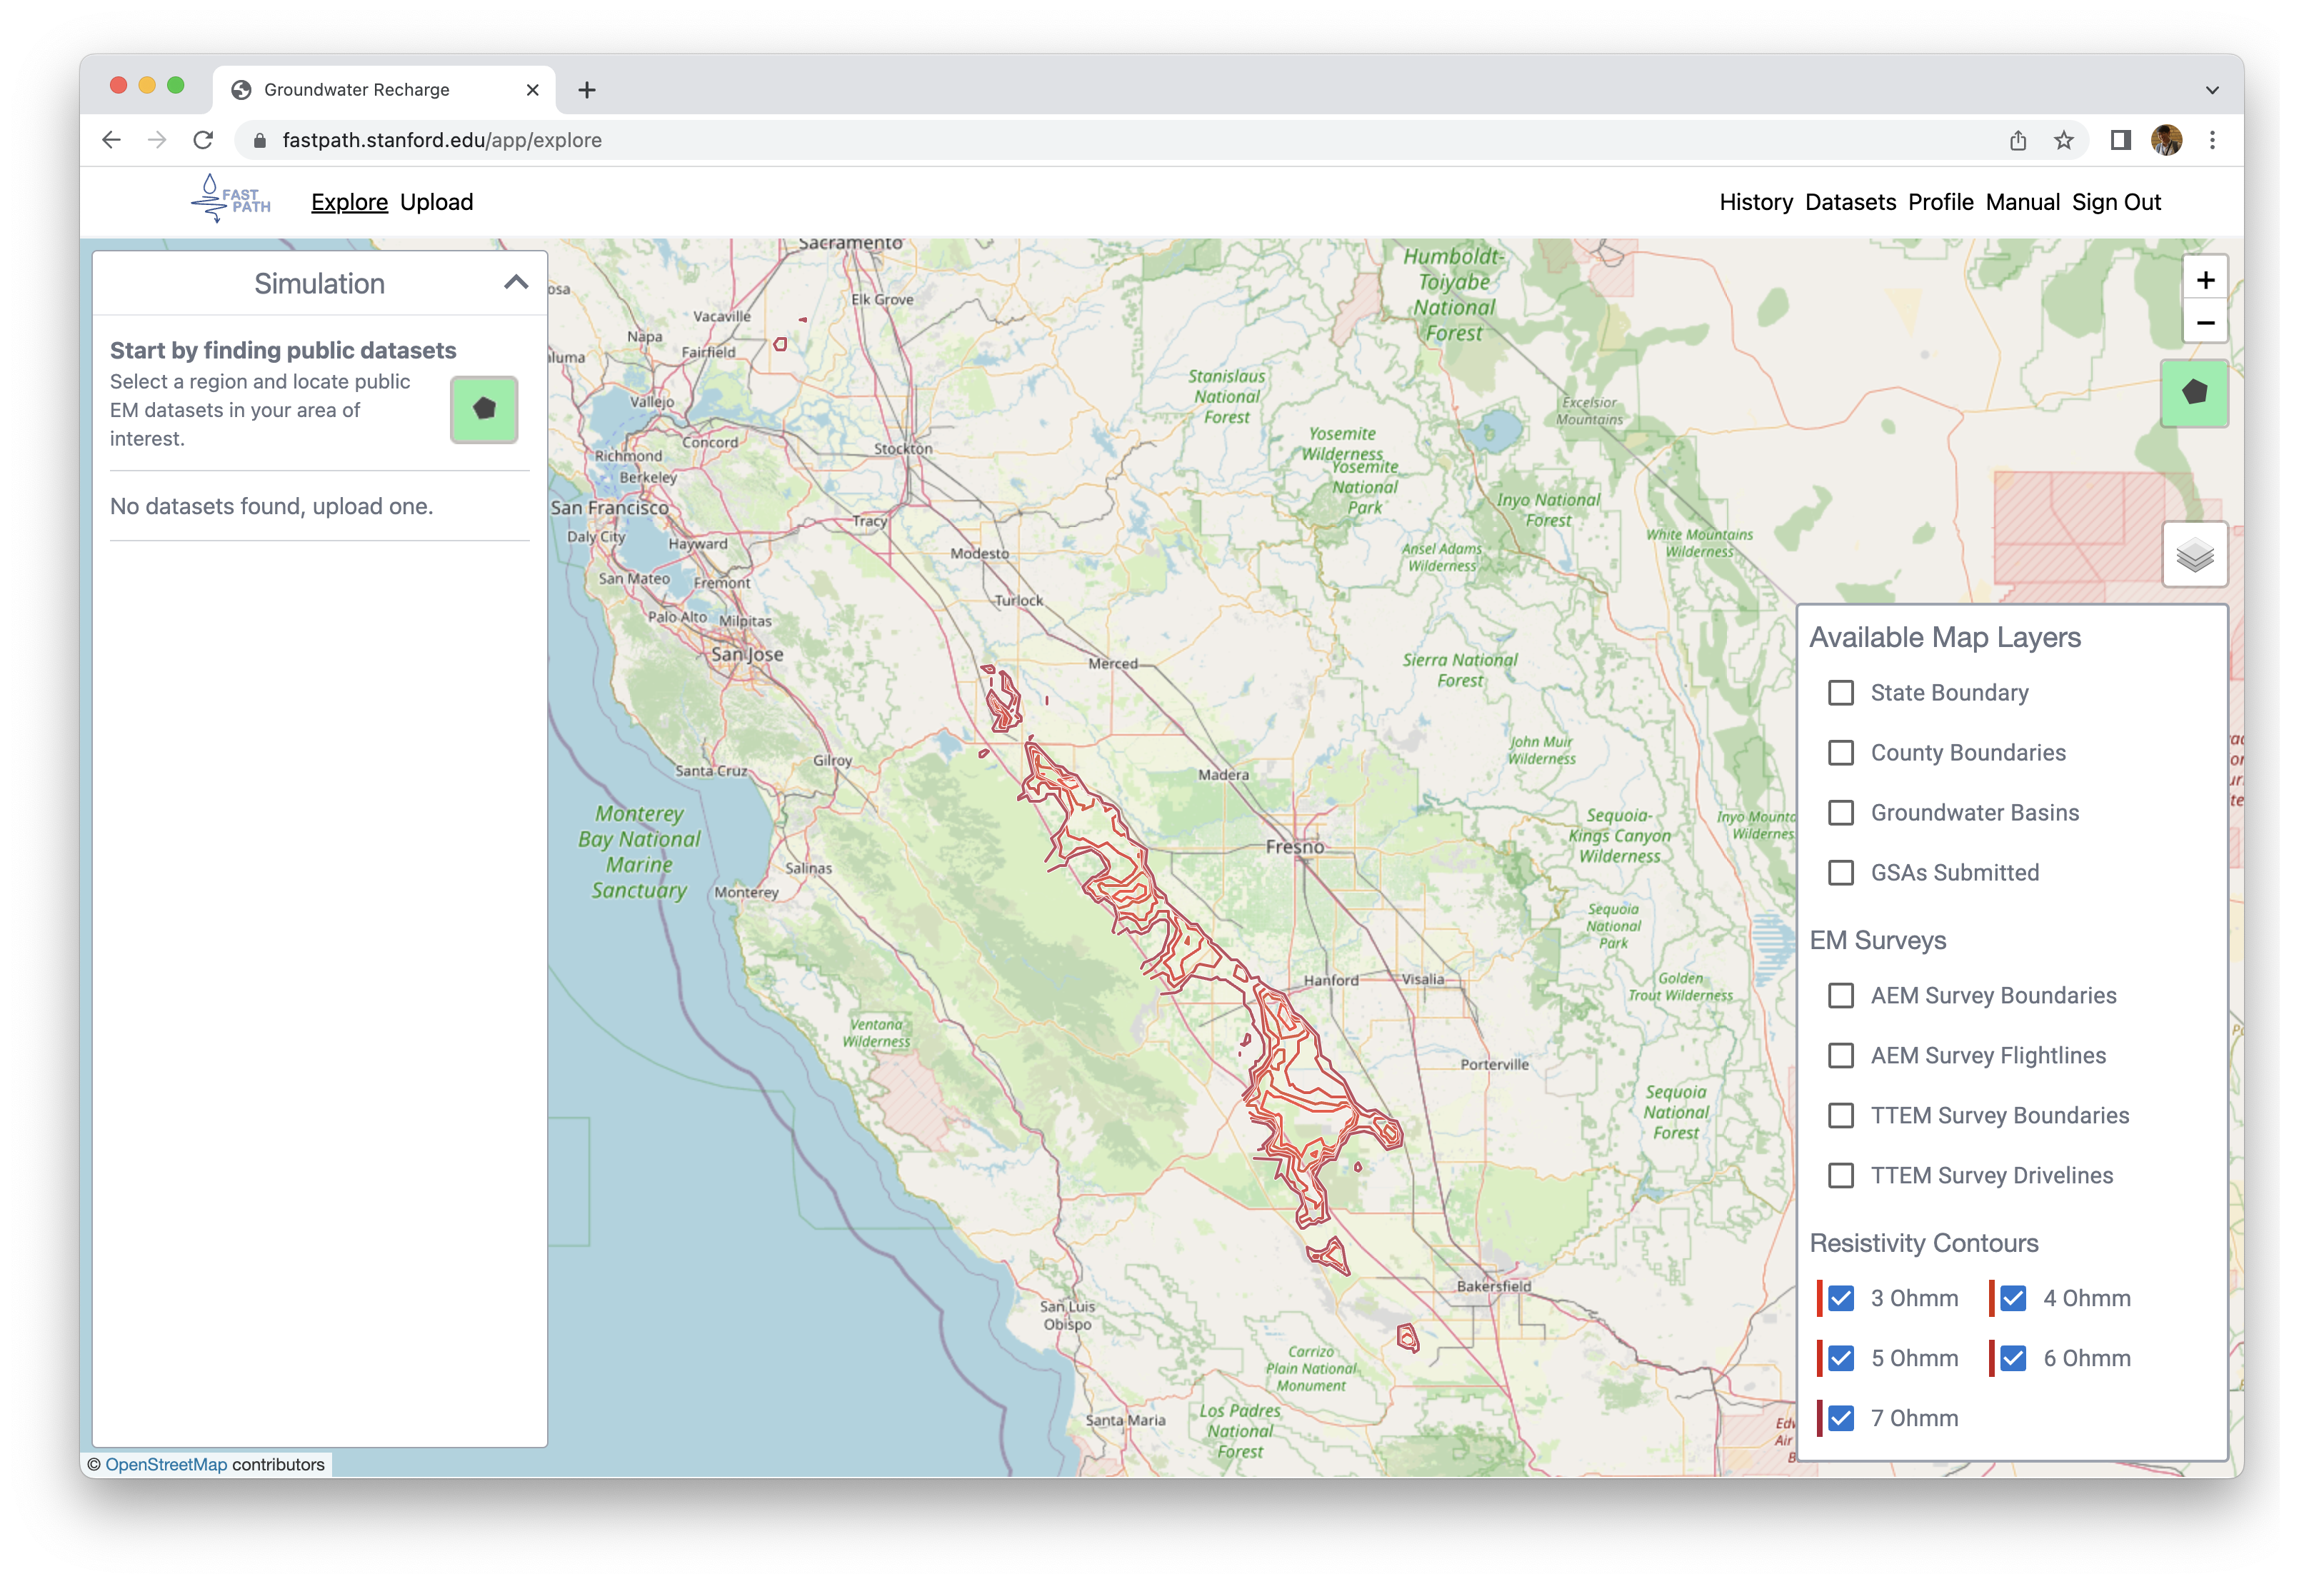
Subsequently, we interpolated these averaged resistivity values to generate resistivity contours ranging from 3 to 7 Ωm. These resistivity contour data provide valuable information about the subsurface resistivity distribution and help in identifying potential brackish regions with increased precision.

Figure 4:An example snap shot from the fastpath app visualizing the low resistivity contours ranging from 3 to 7 m.
- Kang, S., Knight, R., Greene, T., Buck, C., & Fogg, G. (2021). Exploring the Model Space of Airborne Electromagnetic Data to Delineate LargeScale Structure and Heterogeneity Within an Aquifer System. Water Resources Research, 57(10). 10.1029/2021wr029699
- Knight Sustainability Accelerator. (2023). em_data. Redivis. 10.57761/D1TW-HE08
- Goebel, M., & Knight, R. (2021). Recharge site assessment through the integration of surface geophysics and cone penetrometer testing. Vadose Zone Journal, 20(4). 10.1002/vzj2.20131
- Knight Sustainability Accelerator. (2023). sediment_type_data. Redivis. 10.57761/GCNY-MC19
- Knight Sustainability Accelerator. (2023). waterlevel_data. Redivis. 10.57761/GA6S-ZD63